Picking the best python graphs for beginners – Plotly, Seaborn, Matplotlib, Chartify

Are you new to Python and trying to make a beautiful graph? I’ve reviewed four of the most popular and picked the best option for beginners.  For the cells below, I used Jupyer Notebook with these modules that can be installed via pip (pandas, numpy, plotly, cufflinks, seaborn, chartify).

In a normal day, I’ll open my Jupyter Notebook, import a CSV that I created using SQL/Hive.

remember, this doesn't go in jupyter notebook, it goes in your terminal (the thing with a black screen, sort of looks like that thing from The Matrix)

pip install plotly
pip install cufflinks
pip install chartify
pip install seaborn
import pandas as pd
import numpy as np

%matplotlib inline

import pandas as pd


%cd -q Downloads 
#%cd this changes my directory to the Downloads folder

df1=pd.read_csv('blog_example.csv')
#this uses pandas (pd) to read the csv in the Downloads folder
#this example data mimics Google Ad Manager data, but for this exercise, it's full of random numbers

df2=df1.pivot_table(values='imps',index='day',columns='subset',aggfunc='sum')
#I now have two dataframes: df1, df2. This will be used later, depending on the graph

df2.head()
#.head() will show the first five rows of df2 

Download example data here.

Plot.ly

Link

Learning Curve: Low, my pick for best graphing module for beginners.

What I like: Interactive, easiest library to use for beginners, pretty themes out of the box, other features (export, save as png), easy to understand documentation for new users.


What I don’t like: version 2.x is slow.  If you don’t use cufflinks, this becomes one of the most difficult graphing libraries. Requires additional code to run in offline mode.


import plotly
import cufflinks as cf

cf.go_offline() 
#cf.go_offline() allows you to use plotly in jupyter

df2.iplot()

Chartify

Link

What I like: Easy to write, built by Spotify Data Science team.
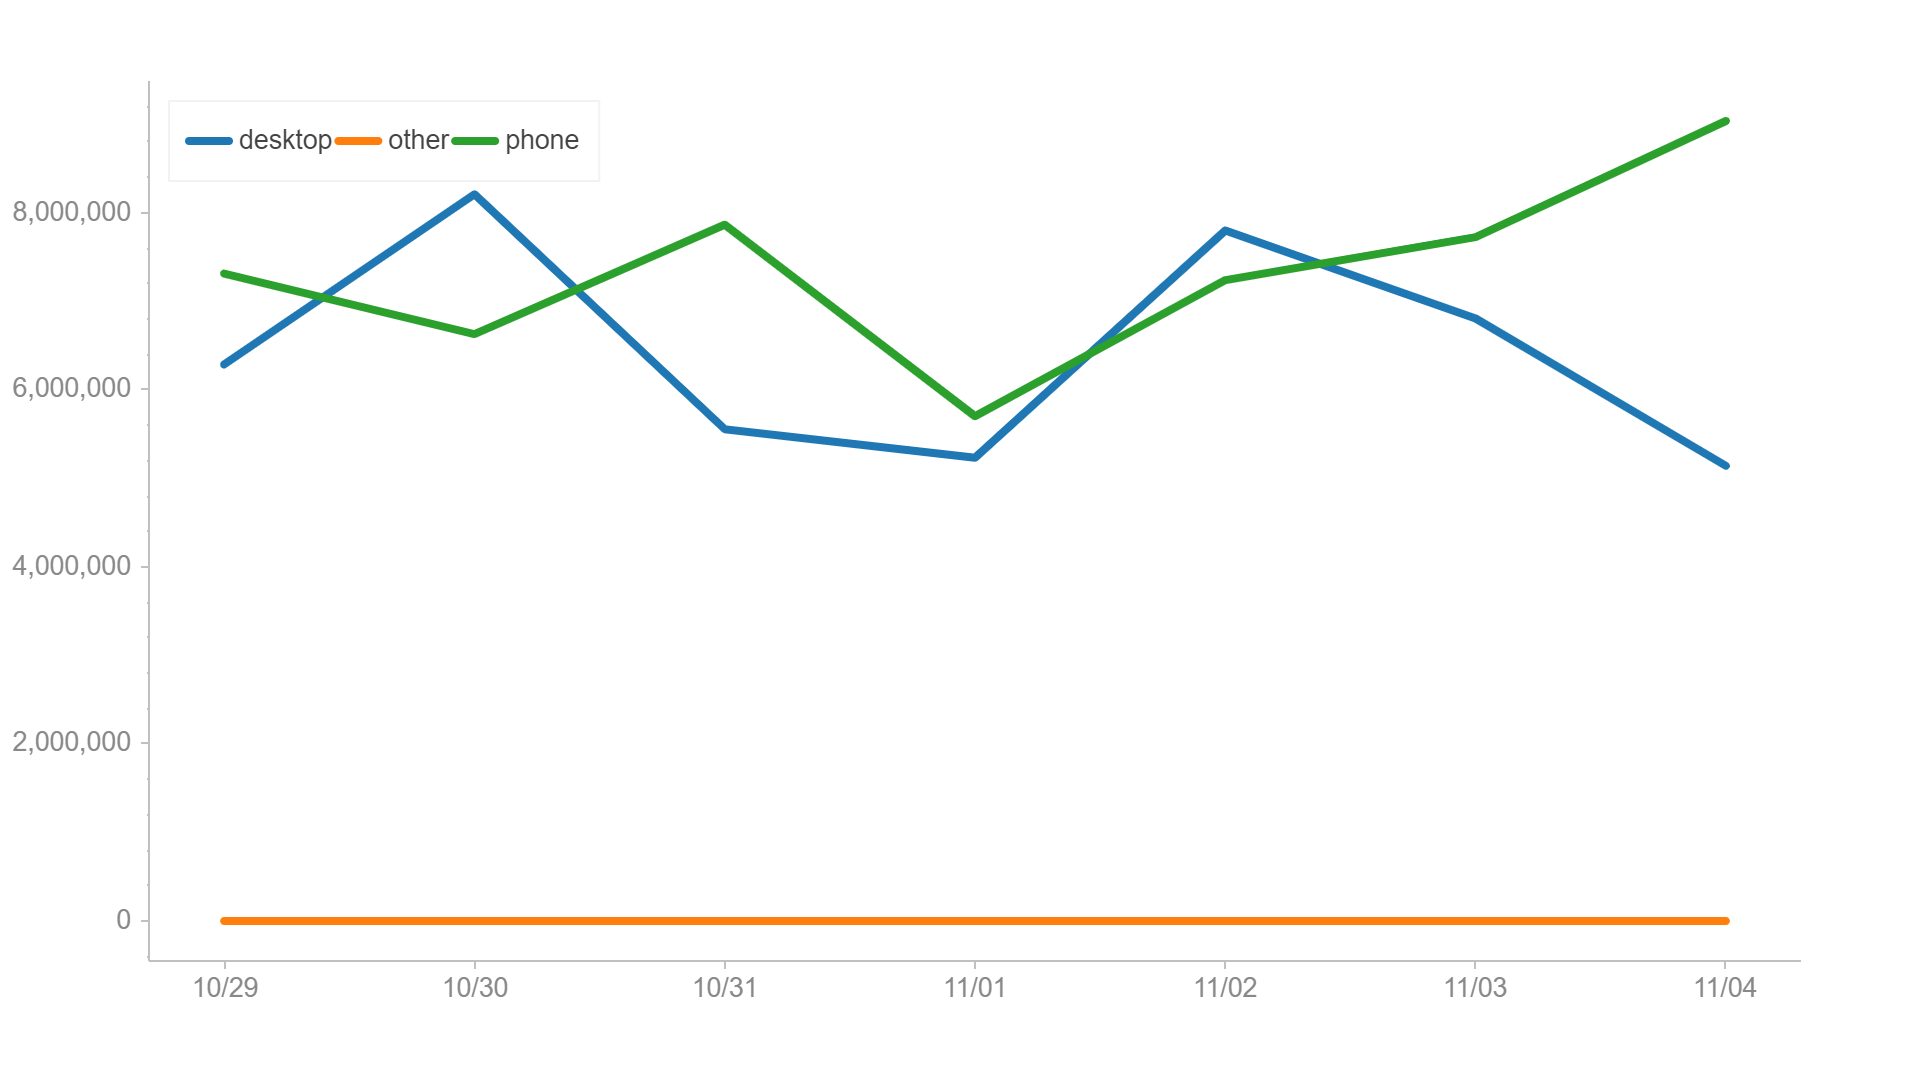
What I don’t like: Requires an additional exe to run (from Google).


import chartify
df=df1.groupby(['day','subset'],as_index=False).sum() 
#chartify can handle a flat table, no need to pivot it

%cd -q
#%cd was needed to change the active directory to 'python', earlier in this lesson I moved it to the Downloads folder. 

ch = chartify.Chart(blank_labels=True, x_axis_type='datetime')

ch.plot.line(
    data_frame=df,
    x_column='day'
    ,y_column='imps'
    ,color_column='subset'
)
ch.show()

Seaborn

Link

pip install seaborn
sns.set()
#sns.set is optional, but I like the formatting
sns.lineplot(x='day',y='imps',hue='subset' ,data=df1,ci=None);

What I like: Pretty visualizations out of the box, great at heatmaps.

What I don’t like: I’ve personally had trouble writing

and remembering the formatting of the plotting functions.

Matplotlib

Link

pip install matplotlib

df1.plot()

Learning Curve:
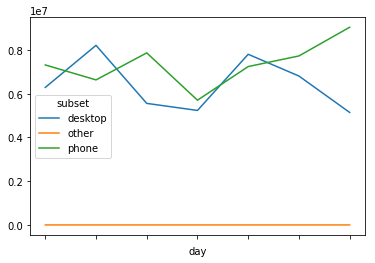
What I like: Customizable, lots of documentation on StackOverflow

What I don’t like: Difficult to remember all the features.  Learning curve is prohibitive to new users.
Analyzing 99 Million Taxi Trips Using Chicago Open Data

The City of Chicago released a dataset containing 100M trips over four years and it’s a huge win for the Open Data community. In this post, we examine the dataset which tells us everything about a passenger’s journey through Chicago, and see dive into the data to see how the industry is beginning to decline as competition from “Ride Shares”, begin to enter the market.

What’s does the average Chicagoan Tip their taxi driver?

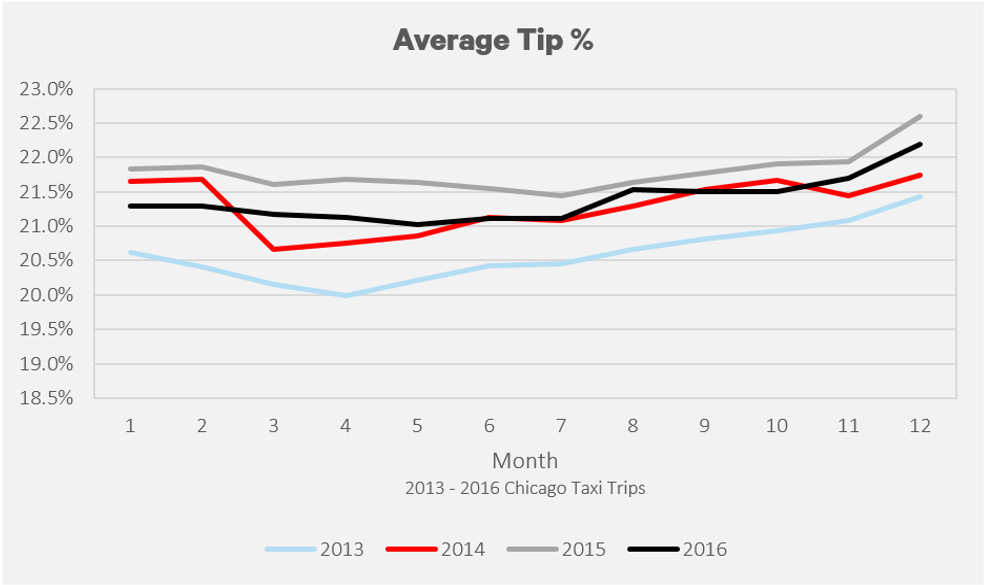
Typically, 21% and that’s been stable since 2013.  Riders do seem to be more generous in December, with 2015 and 2016 having an average of 22% or higher.

Average Monthly Tip % from 2013-2016
What do people normally tip?

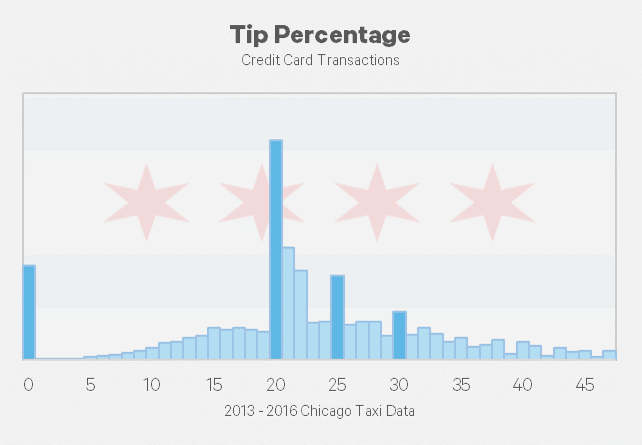
In statistics, a dataset has a “normal distribution” when the mean = median = mode,  in normal terms that means the average = middle number in a dataset = number appearing the most.  From the graph above, we see that it doesn’t have the smoothness of a bell curve, but instead, has sharp spikes around the values of 0%, 20%, 25% and 30%.

From my experience with New York Yellow Taxi Cabs, I assume that the payment system presents passengers with a predefined tip amount when paying.  Based on my analysis, 39% of all passengers use a predefined amount, with non-tippers making up 7% of all rides, and tippers (using the 20/25/30 amount) making up 32% of rides.

Note: Tip amounts in the dataset were only available for passengers who used a credit card.

 How are passengers paying for their ride?

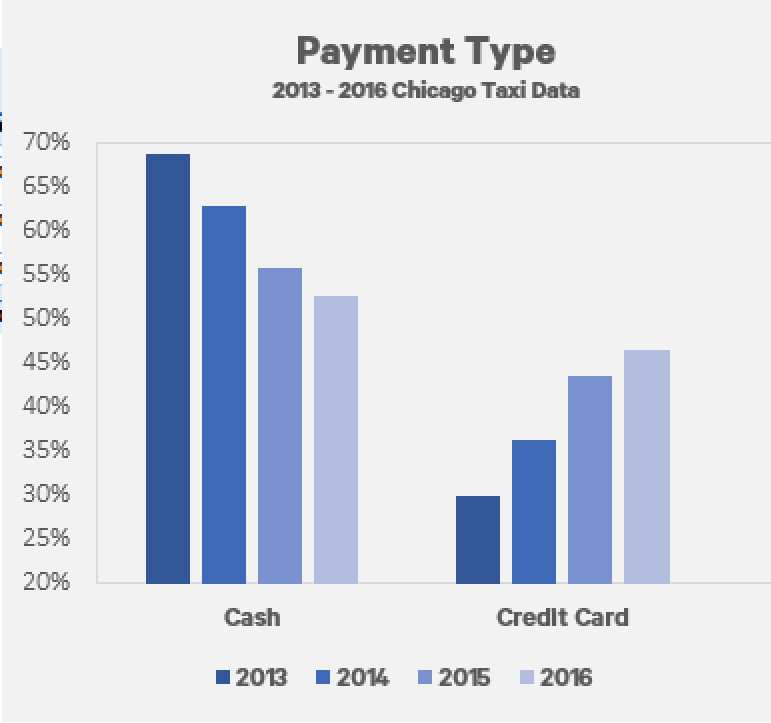
There has been a steady increase in the amount of taxi rides that use a credit card.  From January 2013 to December 2016, the amount of trips using a credit card has increased from 30% to 47%.
Fewer people are using taxis.

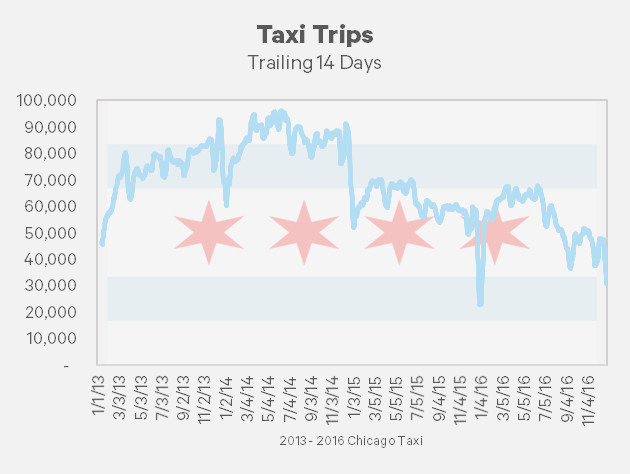
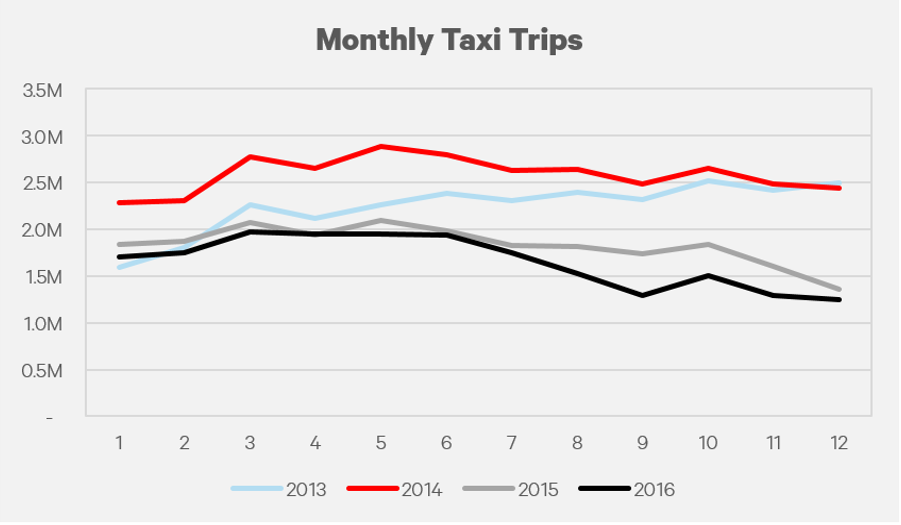
2016 was the worst year for the Chicago Taxi industry with only 19.8M rides, the lowest in four years, and 26% lower than 2013.  Interestingly this didn’t have a huge effect on total fares, while trips were down 26%, fares are dropped 18%.  Similarly, while trips are down 10% from 2015, fares have only dipped 1%.

Putting on my economics hat to investigate this decrease, one possible reason for the decrease could be that riders are substituting taxis for ride sharing apps like Uber or Lyft which provide the same service at an equal or lower price.  Or perhaps it’s the January 2016 fare increase of 15%, that has driven consumers away.  In fairness, a 15% increase in Price and a 10% decrease in Quantity would suggest that the demand is slightly inelastic, but I digress. Other less likely reasons could be changes in public transportation, bikeshare programs, or more walking.

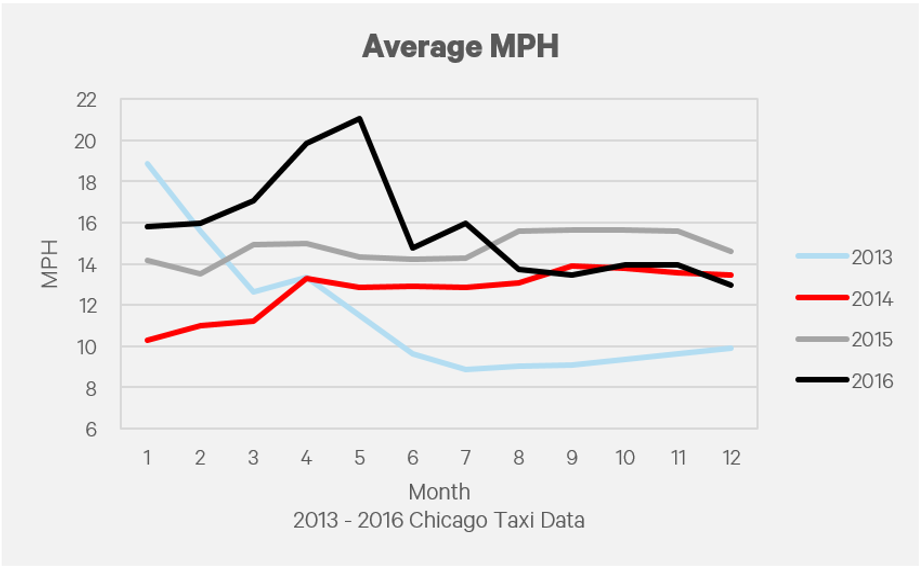
How fast does a taxi travel?

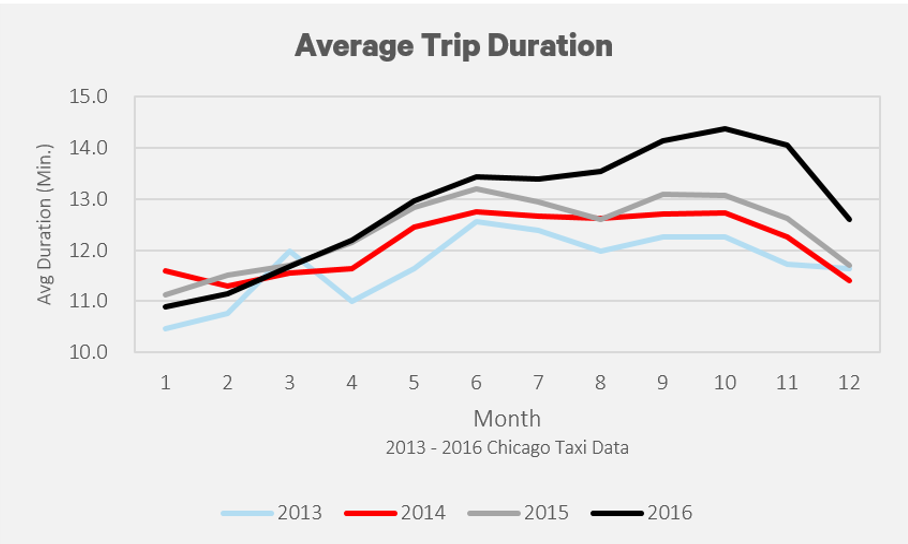
How long does a passenger spend in a taxi?

I found an interesting trend in average trip duration which seems to follow a seasonal trend. The winter months tend to have a shorter trip duration.  With a brutal winter, many passengers likely opt to take a taxi for shorter distances than they would in summer months.

Average time a taxi was in service

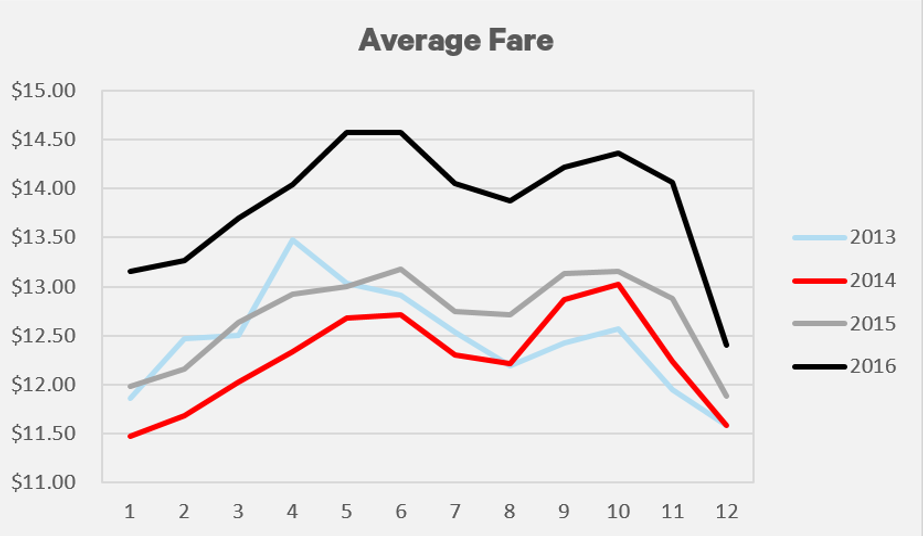
Average Monthly Fare

Similar to the average trip duration, the average fare follows a similar trend.  Winter months have a lower overall fare than the summer months.  January seems to be consistently 10% lower than May for each year in the dataset.


Conclusion

The Chicago Taxi business is in decline and has seen +10% decreases for two consecutive years.  The introduction of competition from ride share apps like Uber and Lyft has surely eaten into their business and will continue to increase market share as their businesses expand.  From a data perspective we found interesting stats on tip percentage, speed, and ride duration while also witnessing the affects of weather on how the city commutes.  This was an interesting dataset, and I want to look closer into the effects of how neighborhoods pickup/ dropoffs, but first I have to learn about Chicago neighborhoods (or do they have buroughs like NYC?).  My next steps will be to compare NYC to Chicago to see how each city’s taxi compares to the others.

Sources:

Big thanks to the City of Chicago (and more specifically Freedom of Information Laws) which released taxi ridership data into the public domain, and another bigger thanks to Google for adding this into the Big Query dataset and allowing users access to query the information and use it for free.  Chicago, NYC and several other datasets can be found in their database.

Data Sources: Taxi Data via Google Big Query

Code and queries: I need to set up a Github link with code used to generate these queries.

Visualizations Sources: Graphs created using Microsoft Excel.

How to run 300 miles

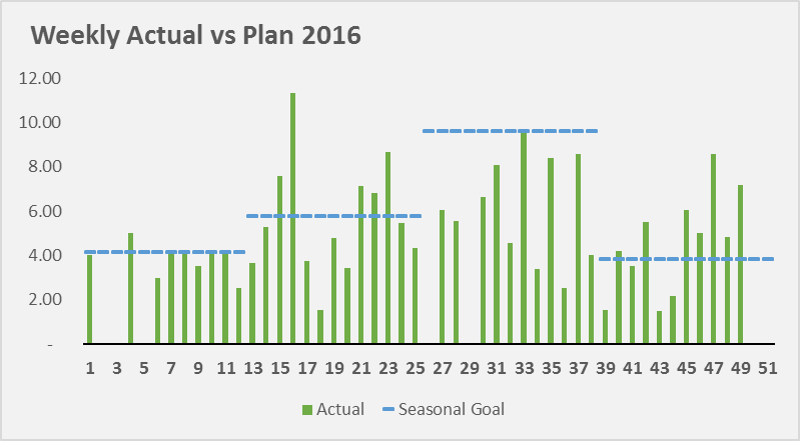
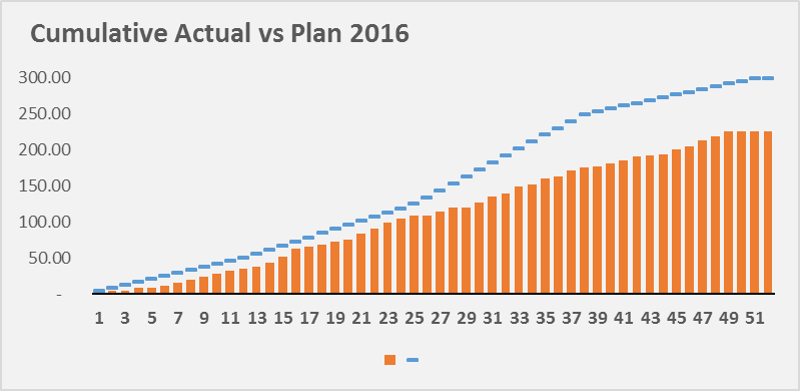
In January 2016, I set a goal for myself that I would run 300 miles in 2016.  This would be a 50 mile increase from 2015 – a year where I ran more than any year previous –  and an 80 mile increase from 2014.  The rules were simple, only running counted toward 300, of the miles run, they had to be recorded in the app, MapMyRun, warmups and cool-downs don’t count towards the mileage, and treadmill running doesn’t count unless it’s over 1.5 miles.

Setting Quarterly Goals

I knew from the start that it’s unlikely that I’ll run the same every week – temperature, daylight, and likelihood of injury all factor into my running decisions.  With this in mind, I set the following quarterly mile goals:  50, 75, 125, and 50 miles.  My rationale was simple, I have less of an opportunity to run in Q1 & Q4 because of weather and an early sunset.  Injury is a major concern too, if I go out to fast in Q1, I could injure myself and be out for a month.

My July – September goals were justified because of the same reasons as my Q1 goal.  From May to August, the sun sets after 7:30p, which allows me enough time to leave work and run 3+ miles.  This takes the burden off of weekends, which means that I’m not dependent on 2 out of 7 days for my ten mile weekly goal.  Also, longer days mean I don’t need use the gym treadmills where I run 2.5 miles before getting too bored to finish.

Reality vs Goals

Part of this post is to be honest with myself.  Even though I modeled this down to the week, I still fell well short of my goal.  To avoid failing again, we need to learn from my mistakes.

We can see that my actual running in Q1 fell short of what I thought was possible.  This is the result of several factors: weather and work.  Jan and Feb were pretty brutal, there was a “blizzard” the first week of February which prevented my from running most of Feb.

Q3 was the biggest reason I missed my goal.  In January I set a personal goal of 125 miles over a 13 week span.  In theory this was easy to achieve, I would need to run 10 miles a week, or run 3.33 miles three times a week (probably Wednesday, Saturday and another date).  In reality I wasn’t able to meet this goal, for reasons I’m still trying to understand.  Part of it may be related to my personal life, I went on more dates on weekdays and weekends.  Another reason may be the 3 mile races I competed in every Wednesday.  These races were tough, and I felt like I had to rest for several days to recover from the races.

Next Steps

Since I didn’t run 300 miles last year I’ve decided to fulfill this goal in 2017.  I’ll need to learn from the mistakes of 2016, and be more proactive in Q3 when the goal is higher.  I’ll also need to determine if I’ll accomplish this with a lot of short runs (1.5 – 3 miles), or longer runs 4 miles.  I’ve entertained the idea of training for a half-marathon to accomplish this with less runs, but I prefer to keep my training (and racees) under 6 miles per run.