The City of Chicago released a dataset containing 100M trips over four years and it’s a huge win for the Open Data community. In this post, we examine the dataset which tells us everything about a passenger’s journey through Chicago, and see dive into the data to see how the industry is beginning to decline as competition from “Ride Shares”, begin to enter the market.
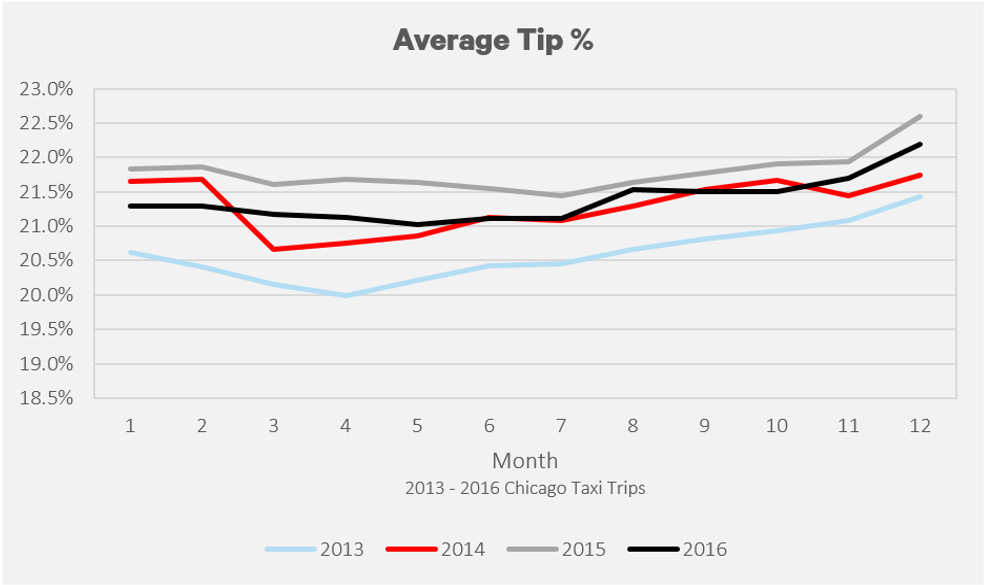
What’s does the average Chicagoan Tip their taxi driver?
Typically, 21% and that’s been stable since 2013. Riders do seem to be more generous in December, with 2015 and 2016 having an average of 22% or higher.
What do people normally tip?
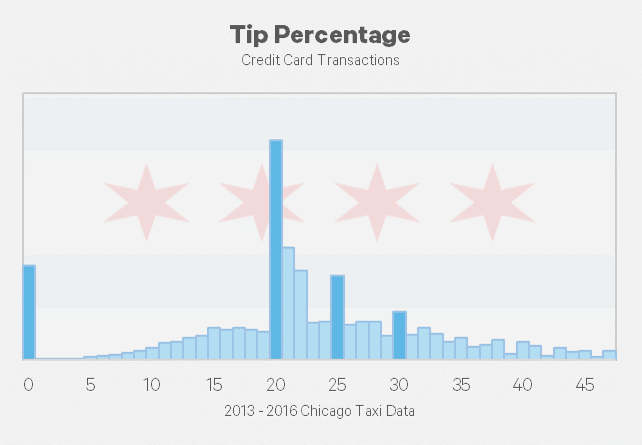
In statistics, a dataset has a “normal distribution” when the mean = median = mode, in normal terms that means the average = middle number in a dataset = number appearing the most. From the graph above, we see that it doesn’t have the smoothness of a bell curve, but instead, has sharp spikes around the values of 0%, 20%, 25% and 30%.
From my experience with New York Yellow Taxi Cabs, I assume that the payment system presents passengers with a predefined tip amount when paying. Based on my analysis, 39% of all passengers use a predefined amount, with non-tippers making up 7% of all rides, and tippers (using the 20/25/30 amount) making up 32% of rides.
Note: Tip amounts in the dataset were only available for passengers who used a credit card.
How are passengers paying for their ride?
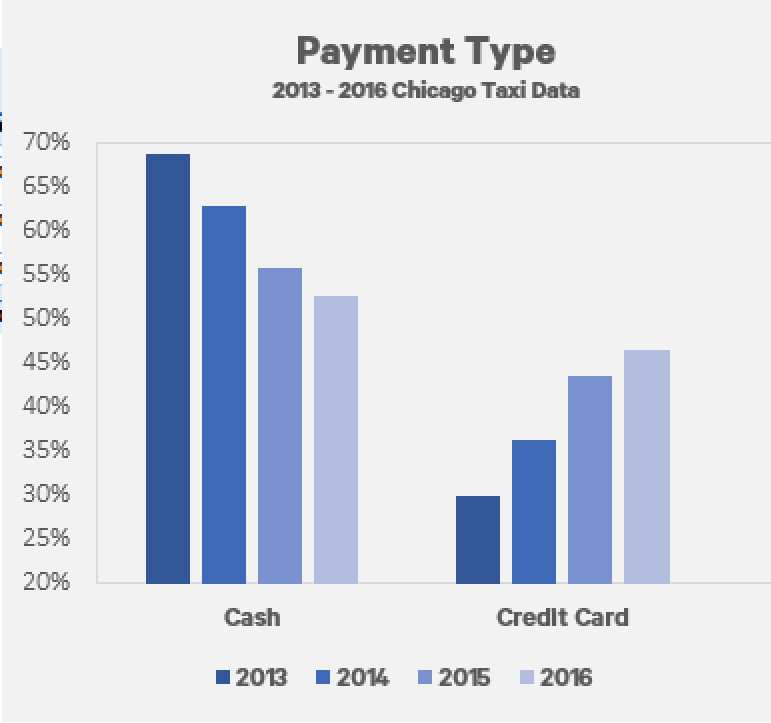 There has been a steady increase in the amount of taxi rides that use a credit card. From January 2013 to December 2016, the amount of trips using a credit card has increased from 30% to 47%.
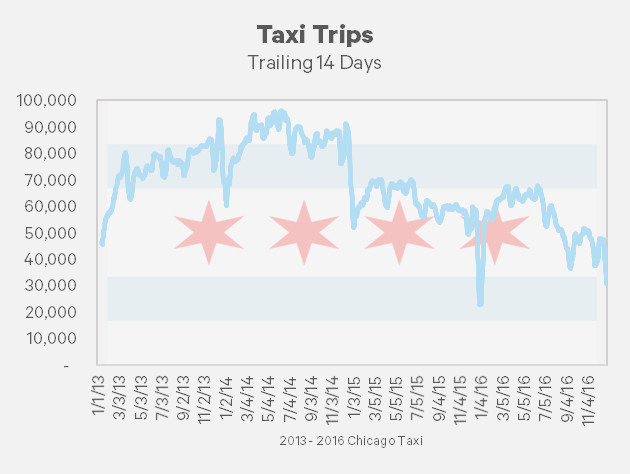
Fewer people are using taxis.
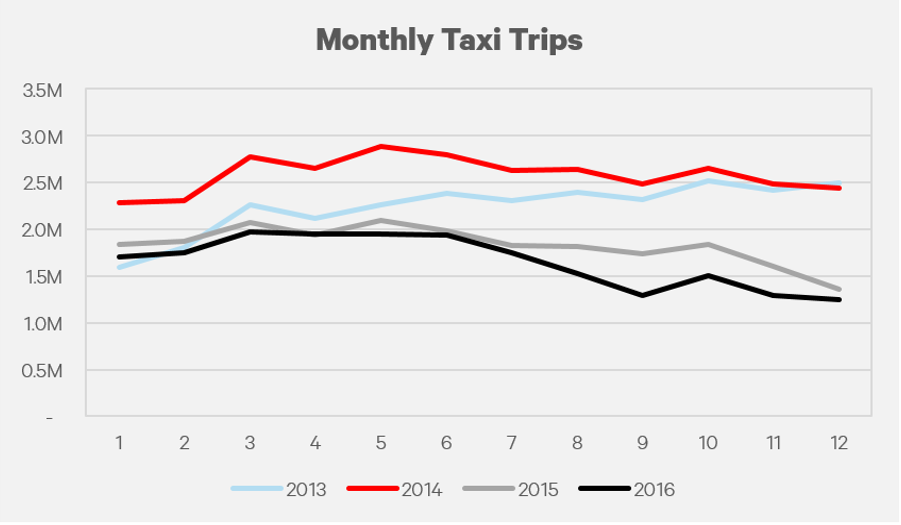
2016 was the worst year for the Chicago Taxi industry with only 19.8M rides, the lowest in four years, and 26% lower than 2013. Interestingly this didn’t have a huge effect on total fares, while trips were down 26%, fares are dropped 18%. Similarly, while trips are down 10% from 2015, fares have only dipped 1%.
Putting on my economics hat to investigate this decrease, one possible reason for the decrease could be that riders are substituting taxis for ride sharing apps like Uber or Lyft which provide the same service at an equal or lower price. Or perhaps it’s the January 2016 fare increase of 15%, that has driven consumers away. In fairness, a 15% increase in Price and a 10% decrease in Quantity would suggest that the demand is slightly inelastic, but I digress. Other less likely reasons could be changes in public transportation, bikeshare programs, or more walking.
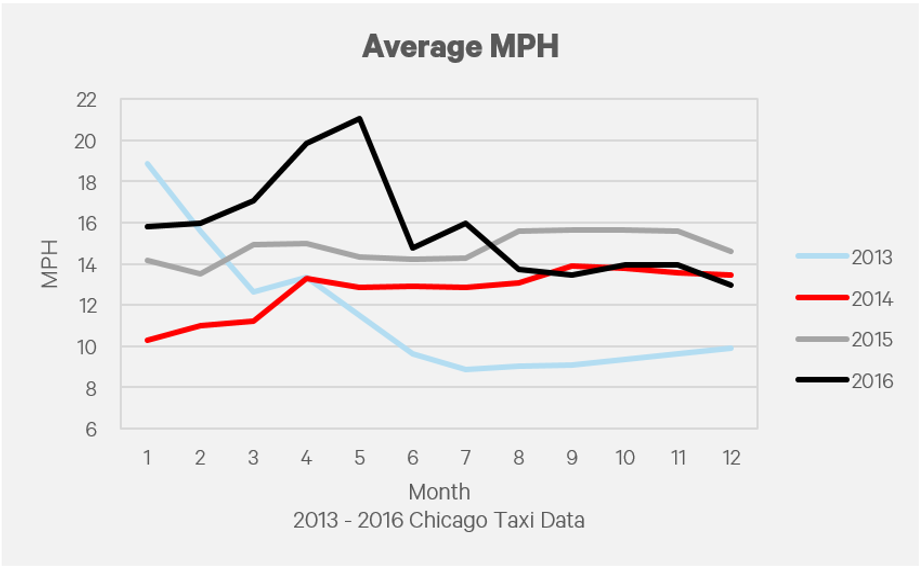
How fast does a taxi travel?
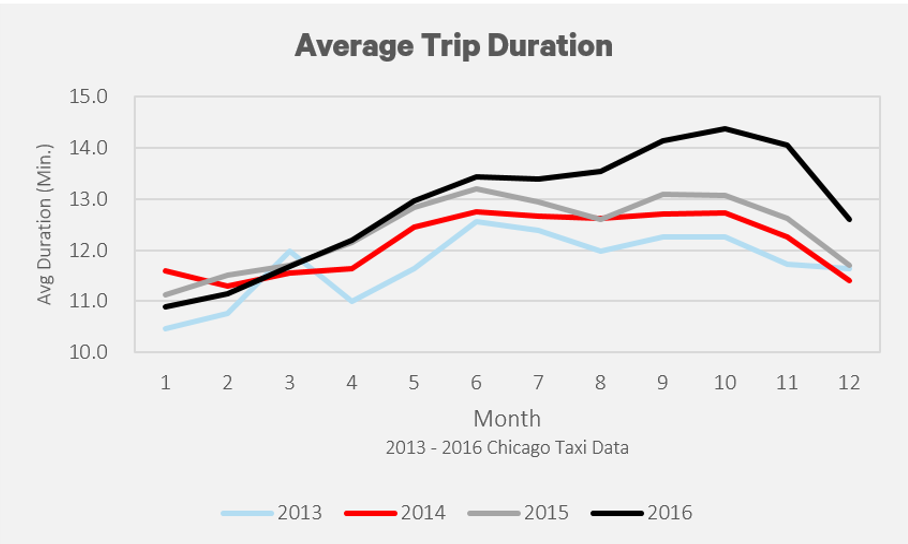
How long does a passenger spend in a taxi?
I found an interesting trend in average trip duration which seems to follow a seasonal trend. The winter months tend to have a shorter trip duration. With a brutal winter, many passengers likely opt to take a taxi for shorter distances than they would in summer months.
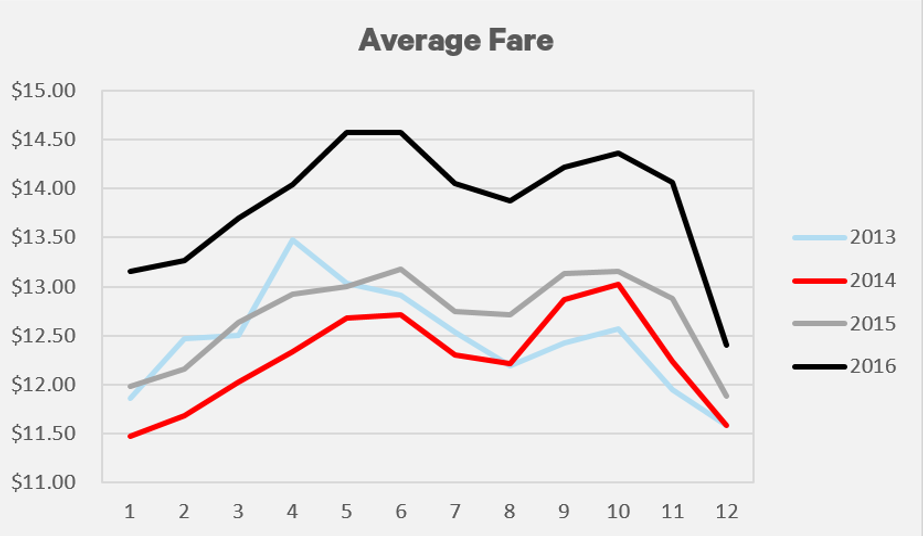
Average Monthly Fare
Similar to the average trip duration, the average fare follows a similar trend. Winter months have a lower overall fare than the summer months. January seems to be consistently 10% lower than May for each year in the dataset.
Conclusion
The Chicago Taxi business is in decline and has seen +10% decreases for two consecutive years. The introduction of competition from ride share apps like Uber and Lyft has surely eaten into their business and will continue to increase market share as their businesses expand. From a data perspective we found interesting stats on tip percentage, speed, and ride duration while also witnessing the affects of weather on how the city commutes. This was an interesting dataset, and I want to look closer into the effects of how neighborhoods pickup/ dropoffs, but first I have to learn about Chicago neighborhoods (or do they have buroughs like NYC?). My next steps will be to compare NYC to Chicago to see how each city’s taxi compares to the others.
Sources:
Big thanks to the City of Chicago (and more specifically Freedom of Information Laws) which released taxi ridership data into the public domain, and another bigger thanks to Google for adding this into the Big Query dataset and allowing users access to query the information and use it for free. Chicago, NYC and several other datasets can be found in their database.
Data Sources: Taxi Data via Google Big Query
Code and queries: I need to set up a Github link with code used to generate these queries.
Visualizations Sources: Graphs created using Microsoft Excel.