Before you start
Install the main packages: tidycensus, tidyverse, and leaflet. The example below will install the packages if you don’t have them. Get a Census Key here.
library_list <- c("leaflet","stringr","sf","tidyverse","tidycensus","purrr","knitr","scales")
for(library in library_list){

  if(!require(library, character.only = TRUE)){
    install.packages(library, dependencies = TRUE)
    require(library, character.only = TRUE )

  }

census_api_key(key = "KEY_GOES_HERE", install = TRUE,overwrite = TRUE)
readRenviron("~/.Renviron")
options(tigris_use_cache = TRUE)
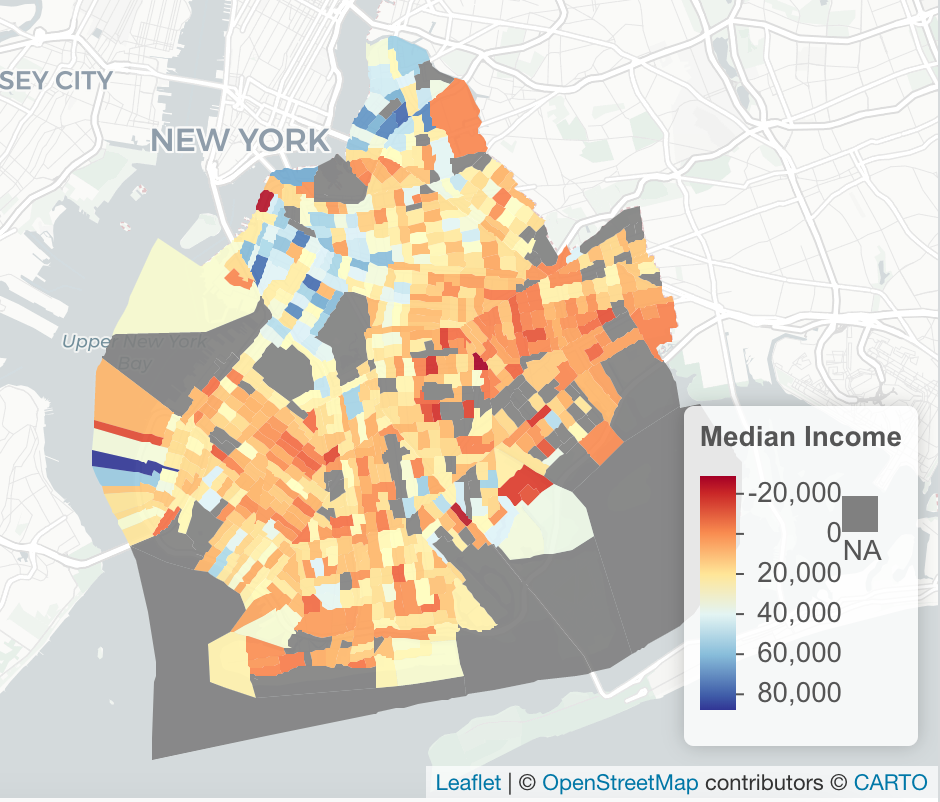
Median Income in Brooklyn
Census data consists of the decennial dataset, which you know as the survey Americans fill out every ten years, and the American Community Survey (ACS) which is completed every year. Every section of the United States has a 12 digit code maintained by the US Census.
The taxonomy format: State (2) – County (3)- Tract (6) – Block Group (1). The code 36047016500 would be interpreted as New York (36), Kings County aka Brooklyn (047 ), Tract (016500).
The ACS tracks over twenty-five thousand statistics for things like: income, educational attainment, travel time, age, household size. For this example, use the median income code of B19013_001. The data is available in granularities like State, Country, Tract, which you can see in the get_acs function as “geography”.
To see every variable tracked by the ACS, run this command.
v17 <- load_variables(2019, "acs5", cache = TRUE)
View(v17)
ny_median<- get_acs(
geography = "tract"
, variables = "B19013_001"
,state = "NY"
,geometry = TRUE
,year=2019)
####Important Areas in New York
# 047 Brooklyn
# 081 Queens
# 061 Manhattan
# 005 Bronx
ny_median<-ny_median %>% filter(
str_detect( GEOID,'36047')
)Interactive Map with Leaflet
ny_df<-st_as_sf(ny_median)

pal <- colorNumeric(palette = "RdYlBu",domain = ny_df$estimate)

m<-ny_df %>%
  st_transform(crs = "+init=epsg:4326") %>%
  leaflet(width = "100%") %>%
  addProviderTiles(provider = "CartoDB.Positron") %>%
  addPolygons(popup = ~ str_extract(estimate, "^([^,]*)"),
              stroke = FALSE,
              smoothFactor = 0,
              fillOpacity = 0.9
              ,color = ~ pal(estimate)
              ) %>%
  addLegend("bottomright",
            pal = pal,
            values = ~ estimate,
            title = "Median Income",
            labFormat = labelFormat(prefix = " "),
            opacity = 1
            )
m
